Wrapping gridded data around the globe#
Scott Wales, CLEX CMS
How to fix blank gaps in plots at the meridian and poles
import numpy
import xarray
import matplotlib.pyplot as plt
import cartopy.crs as ccrs
The Dataset#
We have some sample data, where the values are defined at grid centres. The lat coordinates start and end half a grid spacing from the poles
da = xarray.DataArray(numpy.random.random((10,10)),
                     coords=[
                         ('lat', numpy.linspace(-90,90,num=10, endpoint=False)+18/2),
                         ('lon', numpy.linspace(0,360,num=10, endpoint=False)),
                     ])
pyplot.pcolormesh#
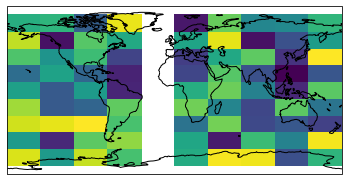
If we try a basic mesh plot with matplotlib, we get blank spaces over the poles and over the meridian where the longitudes wrap around
pcolormesh wants to use the coordinates as the grid corners when plotting, while in our dataset we’ve actually got the grid centres
ax = plt.axes(projection=ccrs.PlateCarree(central_longitude=0))
ax.pcolormesh(da.lon, da.lat, da, transform=ccrs.PlateCarree())
ax.coastlines()
ax.set_extent([-180,180,-90,90])
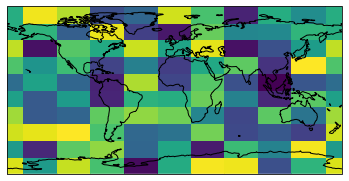
xarray.plot#
Xarray’s plotting automatically knows our coordinates are grid centres, and works out the corner coordinates for us to plot the data accurately
ax = plt.axes(projection=ccrs.PlateCarree(central_longitude=0))
da.plot(ax=ax, transform=ccrs.PlateCarree(), add_colorbar=False)
ax.coastlines()
ax.set_extent([-180,180,-90,90])
Manually finding corners#
We can also manually find the corners - numpy.diff finds the difference between consecutive values in a numpy array, assuming our data is on a regular grid (and so the spacing is the same between all grid cells) we can use this to find the corner coordinates and pass those corners to pcolormesh
dlat = numpy.diff(da.lat)[0]
corner_lat = numpy.concatenate([da.lat - dlat/2, da.lat[-1:] + dlat/2])
corner_lat
array([-90., -72., -54., -36., -18., 0., 18., 36., 54., 72., 90.])
dlon = numpy.diff(da.lon)[0]
corner_lon = numpy.concatenate([da.lon - dlon/2, da.lon[-1:] + dlon/2])

ax = plt.axes(projection=ccrs.PlateCarree(central_longitude=0))
ax.pcolormesh(corner_lon, corner_lat, da, transform=ccrs.PlateCarree())
ax.coastlines()
ax.set_extent([-180,180,-90,90])