Improving maps with Cartopy#
Cartopy is a library for creating plots on maps. We can use it to improve Xarray’s plots (see plotting basics for the basics of Xarray plotting)
Let’s load the data we used in the last page, surface temperature for the ACCESS1.0 AMIP run March 1984:
%matplotlib inline
import xarray
datapath = "http://dapds00.nci.org.au/thredds/dodsC/rr3/CMIP5/output1/CSIRO-BOM/ACCESS1-0/amip/mon/atmos/Amon/r1i1p1/latest/tas/tas_Amon_ACCESS1-0_amip_r1i1p1_197901-200812.nc"
data = xarray.open_dataset(datapath)
surface_temp_slice = data.tas.sel(time = '1984-03')
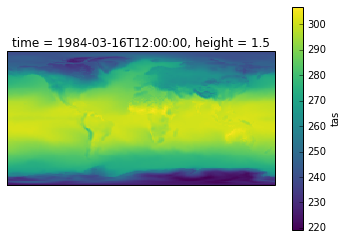
surface_temp_slice.plot()
<matplotlib.collections.QuadMesh at 0x7f0abc9dee80>
Projections#
Cartopy is based around projecting the data in different ways. To use it, we create an axis with a specific projection, then add plots onto that axis.
Note that we don’t need to tell the plot command about our co-ordinates, Xarray does that automatically for us
import cartopy.crs as ccrs
import matplotlib.pyplot as plt
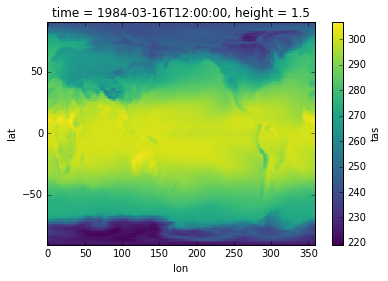
ax = plt.axes(projection=ccrs.PlateCarree())
surface_temp_slice.plot(ax=ax)
<matplotlib.collections.QuadMesh at 0x7f0aaeb45dd8>
Cartopy has a bunch of different projections that you can use.
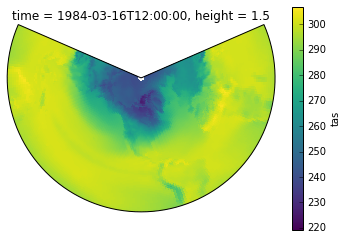
If the data is in a different projection to the axis it’s important to give a transform to plot(). Our data is on a lat-lon grid, so we need to tell Cartopy to transform it from a PlateCarree projection to LambertConfromal
ax = plt.axes(projection=ccrs.LambertConformal())

surface_temp_slice.plot(ax=ax, transform=ccrs.PlateCarree())
<matplotlib.collections.QuadMesh at 0x7f0aae197518>
Cartopy also has some helper functions for showing coastlines etc., which can make it easier to interpret a plot. These work regardless of what projection you are using
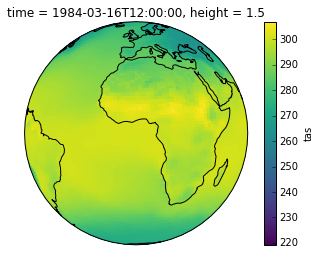
ax = plt.axes(projection=ccrs.Orthographic())

surface_temp_slice.plot(ax=ax, transform=ccrs.PlateCarree())

ax.coastlines()
<cartopy.mpl.feature_artist.FeatureArtist at 0x7f0aada05390>
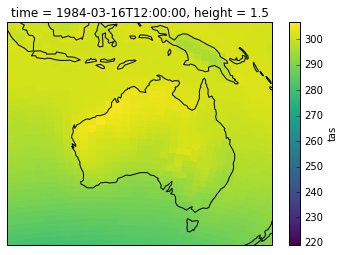
To restrict the plot’s domain you can use ax.set_extent():
import cartopy.crs as ccrs
import matplotlib.pyplot as plt

ax = plt.axes(projection=ccrs.NearsidePerspective(central_latitude=-20, central_longitude=120))

surface_temp_slice.plot(ax=ax, transform=ccrs.PlateCarree())

ax.coastlines()
ax.set_extent([100,160,-45,0])